How-To: Setting up KONG API Gateway Instrumentation
Last updated: June 8, 2026
Introduction
help you gain detailed visibility into your API traffic. By instrumenting your Kong API Gateway with the OpenTelemetry (OTel) plugin, you can feed live data into the Astra Traffic Collector, enabling near-real-time API inventory and vulnerability scanning.
Prerequisites
Astra Traffic Collector must be installed and reachable from your Kong instance.
A Kong Sensor integration must be created in your Astra dashboard to obtain a Sensor ID.
Kong Gateway must be running with admin access (Kong Manager UI or CLI).
Ensure Kong Manager is accessible (default port: 8002).
If Kong Manager is not running on port
8002, you can enable it:# Update your Kong container configuration to expose port 8002 docker run -d --name kong \ -e "KONG_DATABASE=postgres" \ -e "KONG_PG_HOST=kong-database" \ -p 8000:8000 \ -p 8443:8443 \ -p 8001:8001 \ -p 8002:8002 \ # Add this line if missing kong:latestAt least one service and route must already exist in Kong..
Architecture
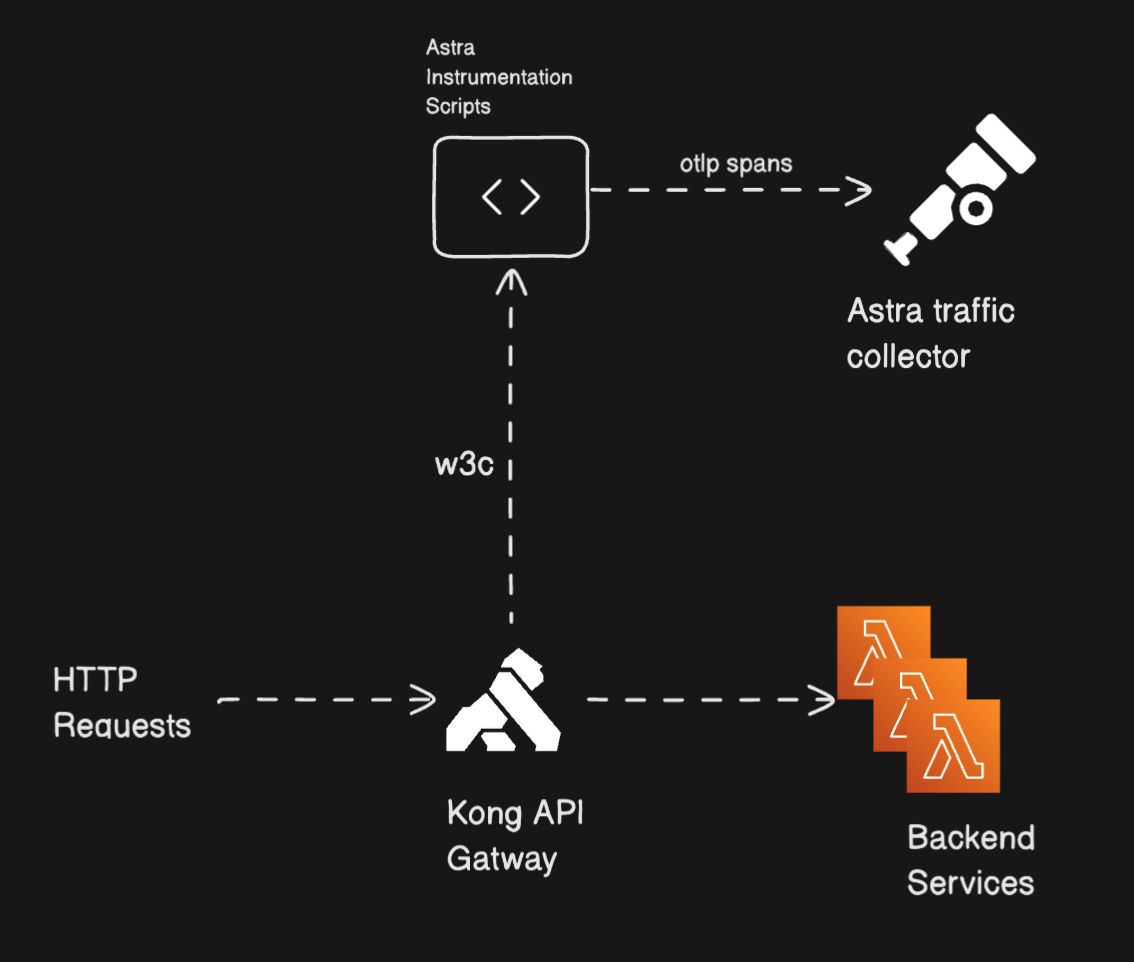
Illustration: High-level integration flow between Kong API gateway and Astra Traffic Collector
Instructions
Step 1. Set Up OTLP/HTTP Receiver in Astra Traffic Collector
Your collector must be configured to receive trace data over HTTP or HTTPS on port 4318 before any plugin can send data to it.
📄 How To Set Up OTLP/HTTP Receiver in Astra Traffic Collector
Locate config_custom.yaml in your Astra Traffic Collector directory.
Ensure the receivers section includes the OTLP protocol for HTTP on port 4318.
Restart the collector service (e.g., systemctl restart astra-traffic-collector.service).
systemctl restart astra-traffic-collector.service
Step 2: Install and Configure the OpenTelemetry Plugin in Kong
The OpenTelemetry plugin traces incoming HTTP requests through Kong and forwards them to your Astra Traffic Collector
Set Environment Variable: Inside your Kong container or node, run:
exportKONG_TRACING_INSTRUMENTATIONS=http_client.# First, access your Kong container docker exec -it kong bash # Then set the environment variable for HTTP instrumentation export KONG_TRACING_INSTRUMENTATIONS=http_clientOpen Kong Manager: Navigate to
http://<kong-ip>:8002.Add Plugin: Go to Plugins > New Plugin and select OpenTelemetry.
Choose scope:
Global: Plugin will apply to all services, routes, and consumers - Recommended for system-wide tracing
Scoped: Plugin will apply to specific targets - Select specific Gateway Services - Select specific Routes - Select s
Configure the Plugin Settings
Traces Endpoint: Enter your collector URL (e.g.,
https://<collector-ip>:4318/v1/traces).Logs Endpoint (Optional) Enter if you want to collect logs from Kong.
Protocols
grpc, grpcs, http, httpsPropagation Settings
Header Type:
w3c
Resource Attributes
sensor.version: "1.0.0"
service.name: "astra-otel-plugin"
sensor.id: "<Sensor ID from your Astra Dashboard>"
Example:
sensor.id: "05927cc2-cf2f-4508-a11e-3001964b9113"Sampling Rate Set a value between
0.0and1.0:0.0— No tracing1.0— 100% of traffic captured
Ensure the value is greater than
0for traces to be collected.Review and Save
Click View Configuration to review all settings before saving.
Verify all parameters are correctly set.
Click Save to apply the configuration. The plugin will become active immediately based on your scope selection.
Verify the Configuration
Confirm the plugin appears in your plugins list with a status of Enabled.
Make a test request through your Kong Gateway.
Verify that sample traces are appearing in your Astra Traffic Collector
Step 3. Add Kong Functions Plugin for Extended Data
To capture request/response headers and bodies, you must add the Kong Functions plugin using Lua scripts.
In Kong Manager, go to Plugins > New Plugin and select Kong Functions.
Configure Access Phase: Paste the provided Lua script into the Access field to capture client IPs and request metadata.
Find the "Access" field and paste the following code
-- Access phase handler
local root_span = kong.tracing.active_span()
if not root_span then
    kong.log.err("No active span found")
    return
end

-- Get direct client IP (load balancer or actual client)
local peer_addr = kong.client.get_ip()
kong.log.debug("Direct client IP: ", peer_addr)

if peer_addr then
    root_span:set_attribute("net.sock.peer.addr", peer_addr)
end

-- Add http.target
root_span:set_attribute("http.target", kong.request.get_path_with_query())

local function escape_json_value(v)
    if type(v) == "string" then
        return (v:gsub('"', '\\"'))
    end
    return v
end

local headers = kong.request.get_headers()
if headers then
    local headers_str = "{"
    local first = true
    for k, v in pairs(headers) do
        if not first then
            headers_str = headers_str .. ", "
        end

        headers_str = headers_str .. '"' .. k .. '": '

        if type(v) == "table" then
            headers_str = headers_str .. '"' .. escape_json_value(table.concat(v, ",")) .. '"'
        elseif type(v) == "number" then
            headers_str = headers_str .. tostring(v)
        else
            headers_str = headers_str .. '"' .. escape_json_value(tostring(v)) .. '"'
        end

        first = false
    end
    headers_str = headers_str .. "}"
    root_span:set_attribute("http.request.headers", headers_str)
end

-- Add request body in access phase
local ok, body = pcall(kong.request.get_raw_body)
if ok and body then
    root_span:set_attribute("http.request.body", body)
end
Configure Body Filter: Paste the body filter script into the Body Filter field to capture the response body (limited to 1MB).
Find the "Body Filter" field and paste the following code:
-- Constants
local MAX_BODY_SIZE = 1024 * 1024  -- 1MB in bytes

-- Body filter phase handler
local root_span = kong.tracing.active_span()
if not root_span then
    return
end

-- Get chunk and eof flag safely
local chunk, eof
if ngx.arg[1] ~= nil then
    chunk = ngx.arg[1]
end
if ngx.arg[2] ~= nil then
    eof = ngx.arg[2]
end

-- Initialize response_chunks and total size if needed
kong.ctx.shared.response_chunks = kong.ctx.shared.response_chunks or {}
kong.ctx.shared.response_size = kong.ctx.shared.response_size or 0

-- Track size and collect chunks for tracing only
if chunk and type(chunk) == "string" then
    kong.ctx.shared.response_size = kong.ctx.shared.response_size + #chunk
    if kong.ctx.shared.response_size <= MAX_BODY_SIZE then
        table.insert(kong.ctx.shared.response_chunks, chunk)
    end
end

-- Always pass through the original chunk unmodified
ngx.arg[1] = chunk

-- On EOF, set the complete body for tracing
if eof then
    local body = ""
    if kong.ctx.shared.response_size <= MAX_BODY_SIZE then
        body = table.concat(kong.ctx.shared.response_chunks)
    end
    root_span:set_attribute("http.response.body", body)
    kong.ctx.shared.response_chunks = nil
    kong.ctx.shared.response_size = nil
end
Configure Header Filter: Paste the header filter script into the Header Filter field to capture response headers in JSON format.
Find the "Header Filter" field and paste the following code:
-- Header filter phase handler
local root_span = kong.tracing.active_span()
if not root_span then
    return
end

-- Function to escape JSON string values
local function escape_json_value(v)
    if type(v) == "string" then
        return (v:gsub('"', '\\"'))
    end
    return v
end

-- Add response headers in JSON-like string format
local headers = kong.response.get_headers()
if headers then
    local headers_str = "{"
    local first = true
    for k, v in pairs(headers) do
        if not first then
            headers_str = headers_str .. ", "
        end

        headers_str = headers_str .. '"' .. escape_json_value(k) .. '": '

        if type(v) == "table" then
            headers_str = headers_str .. '"' .. escape_json_value(table.concat(v, ",")) .. '"'
        elseif type(v) == "number" then
            headers_str = headers_str .. tostring(v)
        else
            headers_str = headers_str .. '"' .. escape_json_value(tostring(v)) .. '"'
        end

        first = false
    end
    headers_str = headers_str .. "}"
    root_span:set_attribute("http.response.headers", headers_str)
end
Save the plugin.
Expected Outcome
Once configured, send test REST API requests through your Kong Gateway. You should receive a success response from your API, and the corresponding traffic traces will appear in your Astra Traffic Collector logs and your dashboard’s API Inventory.
Troubleshooting & Support
Traces not appearing: Verify that the collector endpoint is reachable from the Kong node and that the sampling rate is greater than 0.
Protocol Mismatch: Ensure the protocols (HTTP/HTTPS) configured in the OpenTelemetry plugin match your service configuration.
Log Verification: You can inspect the logs of your Astra Traffic Collector (using docker logs astra-traffic-collector) to confirm successful trace ingestion.
Further Assistance: If you encounter issues during the setup, please raise a support ticket via the dashboard widget or contact us at help@getastra.com.